
Projects › Case study
Indiana municipal plant: energy and process optimization
An energy and process audit at a large activated sludge plant cut the O&M budget by $536,550 per year, added $3,832,000 of process capacity and improved effluent quality.
What we did
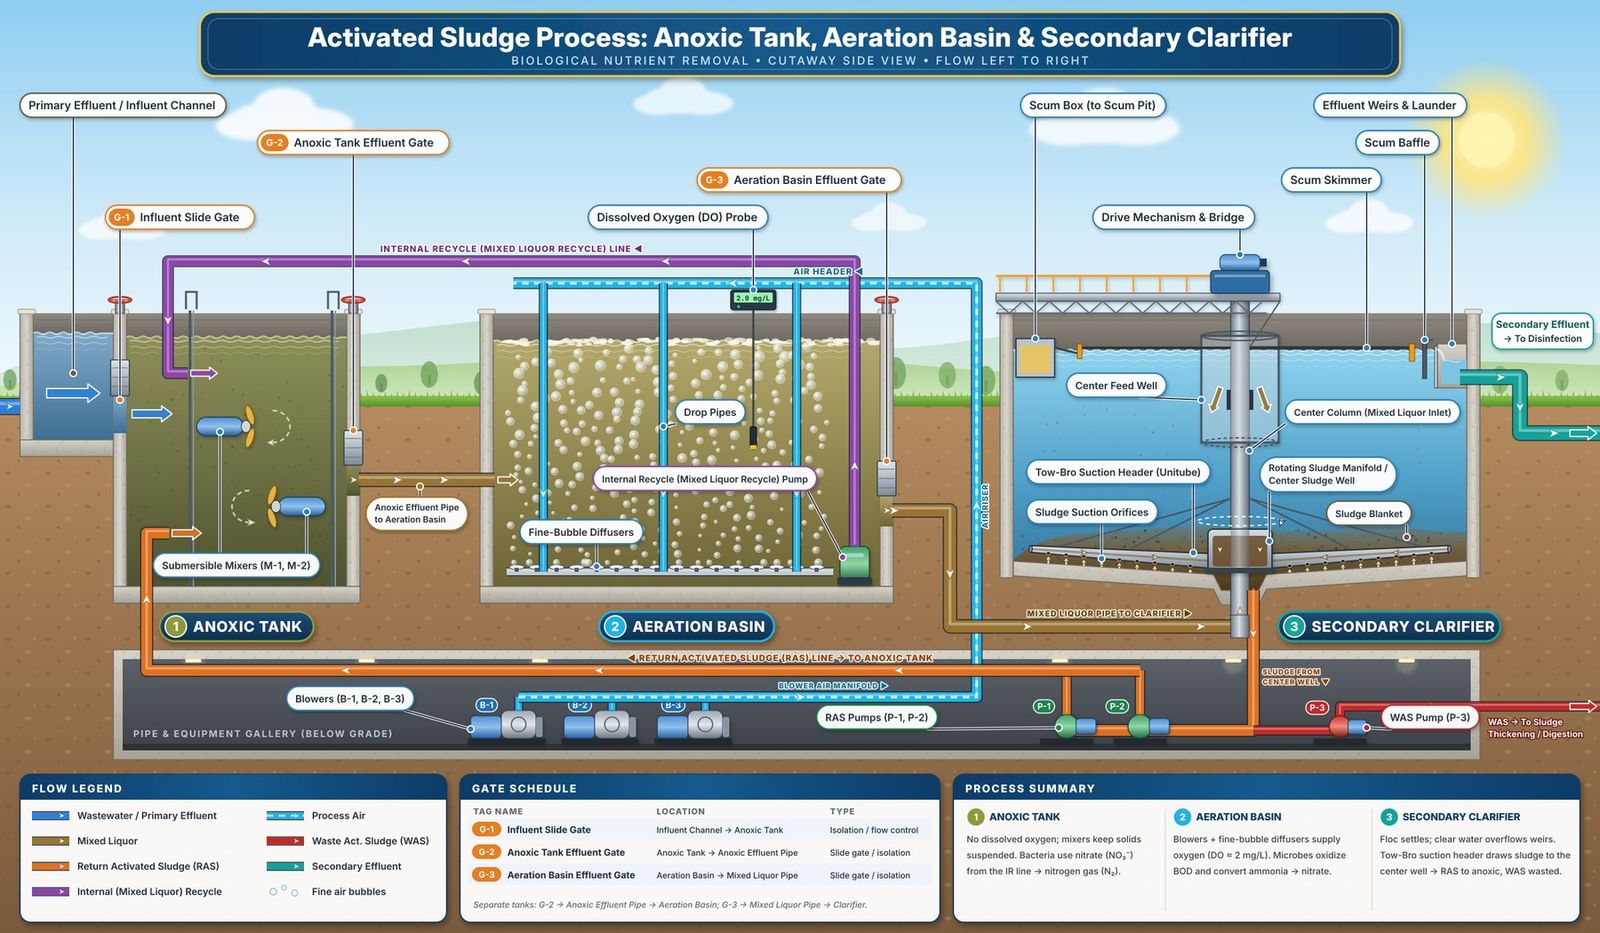
We audited the processes at a large activated sludge plant in Indiana, looking at treatment performance as well as energy and chemical costs. Our process improvements lowered electricity, natural gas, biosolids hauling and labor costs, and they freed up capacity in the digester, the gravity belt thickener and the aeration system.
The process changes also sent about 8 mgd less flow to the secondary clarifiers, and the plant ended with a lower risk of ammonia, BOD and solids violations.
Before and after
Where we have both the starting point and the result, they are shown here. The second table lists the other gains.
Before and after
| Measure | Before | After | Change |
|---|---|---|---|
| Waste sludge to the thickener | 360,000 gallons per day | 130,000 gallons per day | 64% less |
| Gravity belt thickener run time | 15 hours a day | 4.5 hours a day | 10.5 hours a day less |
Treatment performance, 2008 compared with 2007
| Treatment area | Performance gain |
|---|---|
| Biosolids hauled | 6.5 million fewer gallons |
| Primary sludge | About 50% less, 23,000 fewer gallons a day pumped to the digesters |
| Effluent BOD | 57% less discharged |
| Effluent TSS | 16.4% less discharged |
| Effluent ammonia | 10% less discharged |
| Digester capacity | 24% more detention time available |
| Aeration capacity | 9.4% more ammonia treatment capacity |
| Stability | Lower risk of ammonia, BOD and solids violations |
Savings and capacity
Energy, chemical and labor savings
| Savings area | Per year | What changed |
|---|---|---|
| Electricity, primary meter | $102,000 | 25% reduction in kWh used |
| Electricity, secondary meter | $96,400 | 20% reduction in kWh used |
| Natural gas | $90,000 | 55% reduction, with winter savings valued at $10,000 to $20,000 a month |
| Biosolids hauling | $208,000 | 6.5 million gallons less biosolids hauled in 2008 than in 2007 |
| Labor | $40,150 | Less belt thickener run time, from 15 to 4.5 hours a day |
| Total savings | $536,550 | per year. Chemical savings were still being determined. |
Capacity gains
| Process | Capacity value | What changed |
|---|---|---|
| Digester | $1,900,000 | 24% more detention time available |
| Gravity belt thickener | $1,650,000 | Longer equipment life, running 4.5 hours a day instead of 15 |
| Aeration | $282,000 | 9.4% more ammonia treatment capacity |
| Secondary clarifiers | Not valued | Process changes sent about 8 mgd less flow to the clarifiers |
| Added capacity | $3,832,000 | value over a 15 to 20 year life |